Power Law
I first heard about power laws in a Veritasium video. After watching it, I started wondering what other things in the world follow a power law. Since my FYP is about Atrial Fibrillation (AF), I wondered whether AF episode duration also follows a power law.
Data
I had already downloaded several datasets, so I just needed to extract the AF durations from them. Claude wrote a script to do this, which I ran to obtain the AF durations. I then plotted the number of AF events against AF duration.
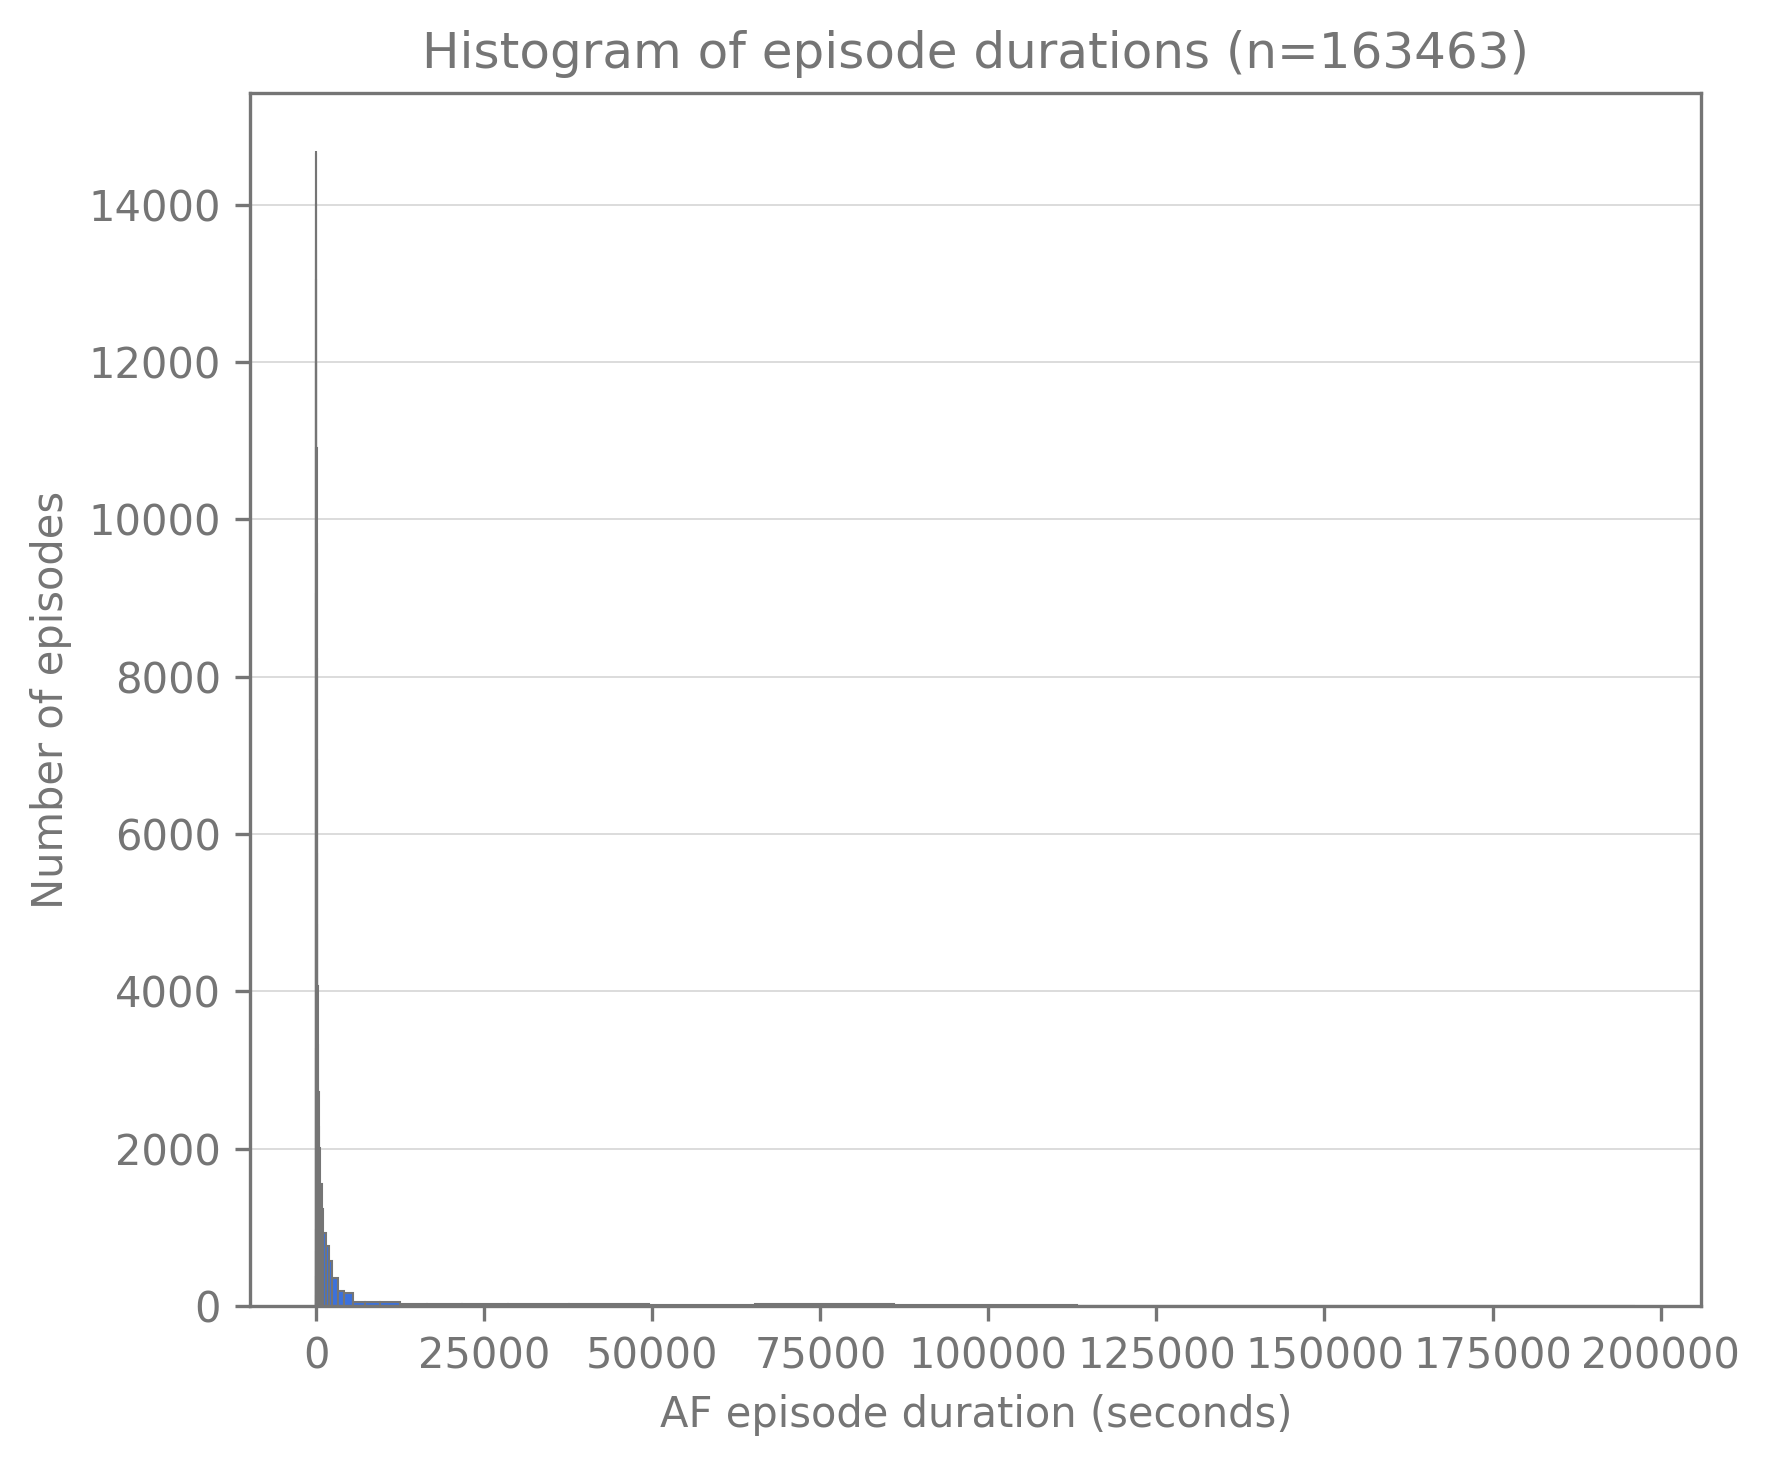
As you can see from the histogram, the AF duration clearly does not follow a normal distribution. So I re-plotted the histogram on a log-log scale to check whether it follows a power law instead.
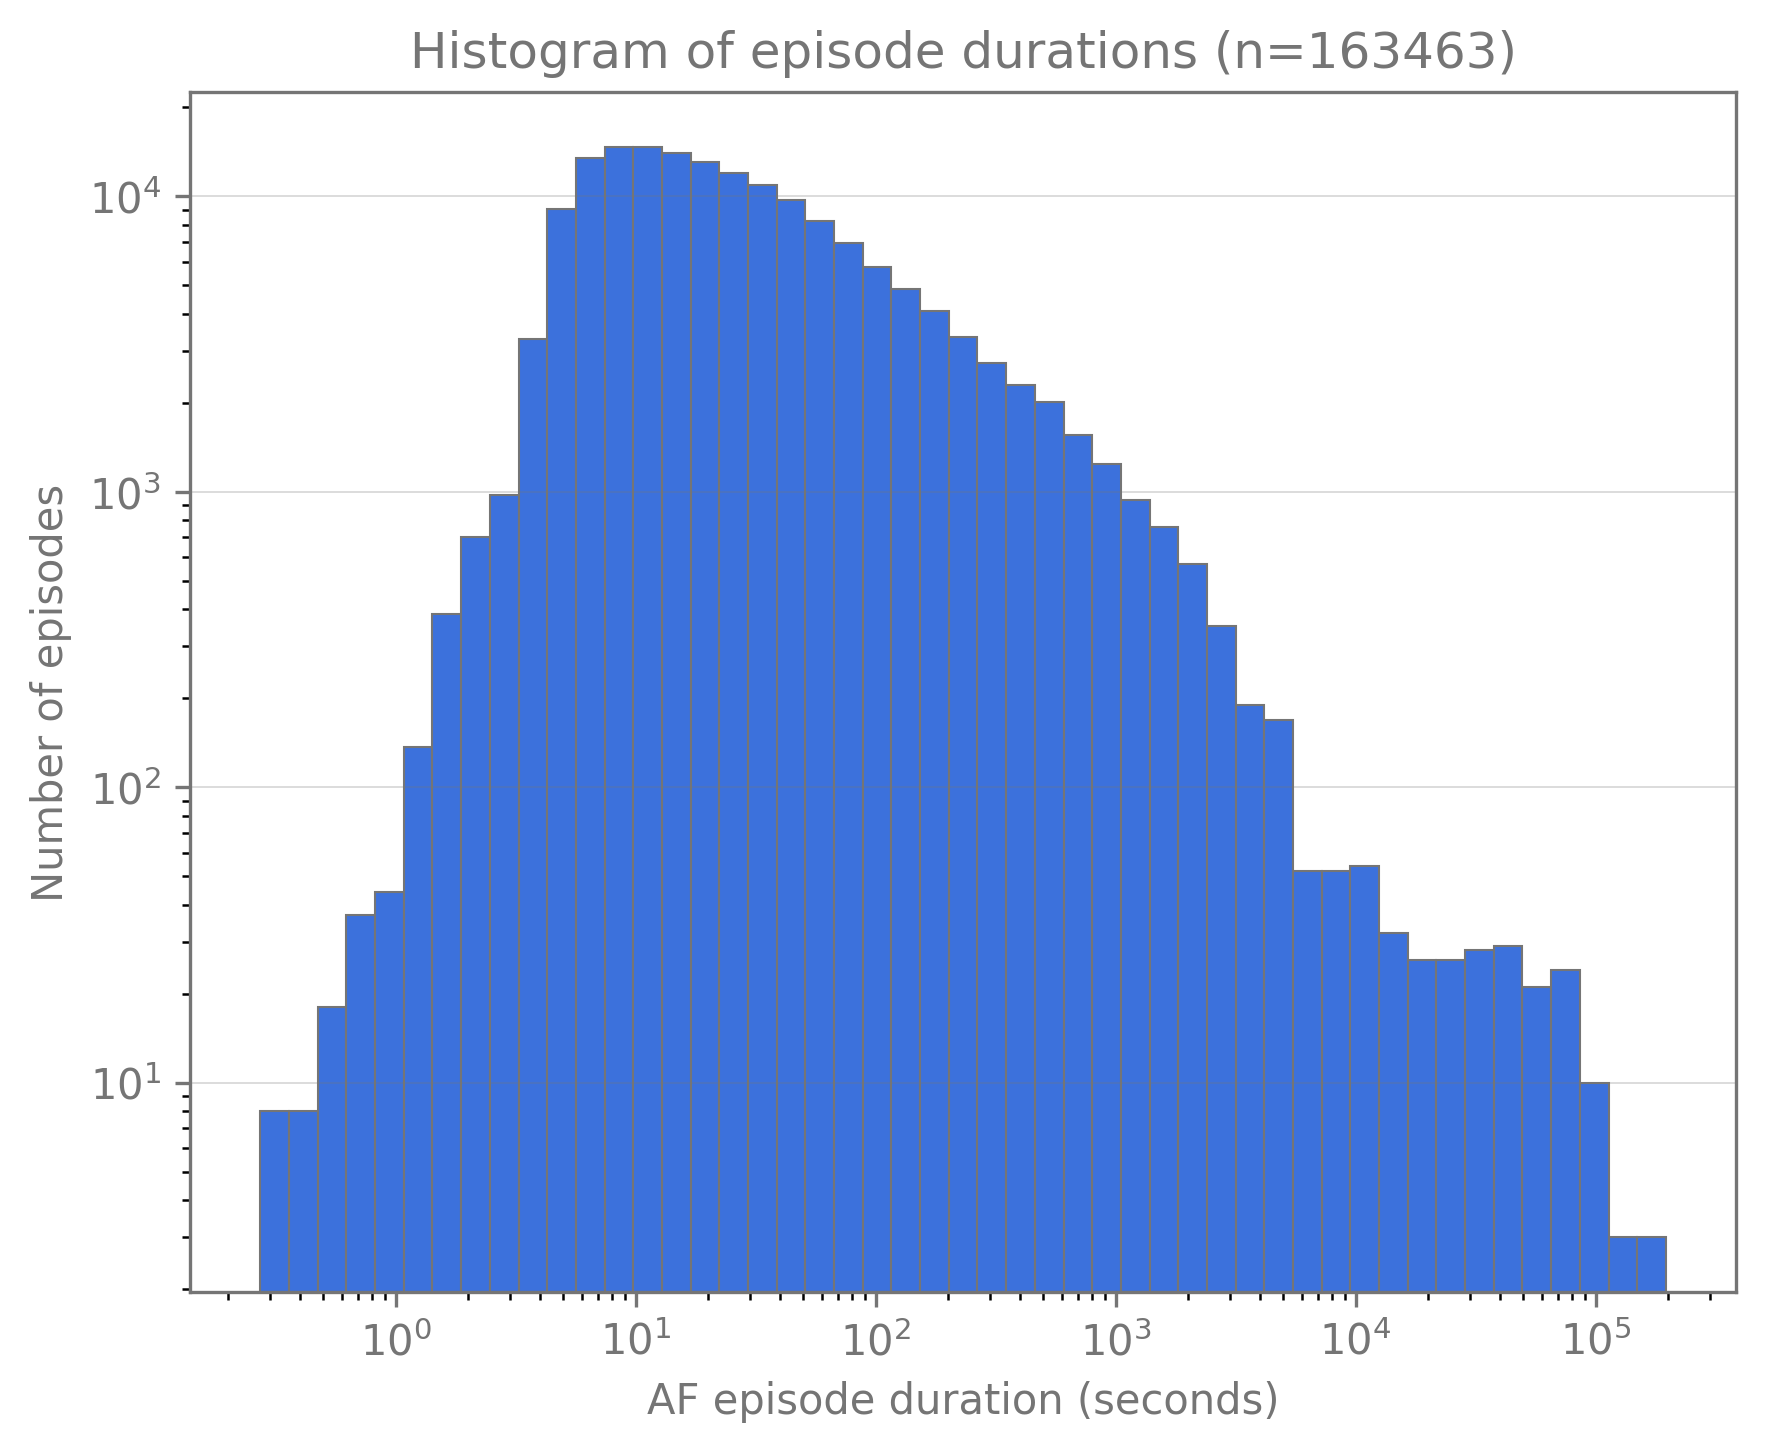
In log space, the distribution now looks somewhat normal (i.e., log-normal-ish) rather than following a power law, since a true power law should appear as a straight line on a log-log plot. So I tried fitting a power-law distribution to the data to see how well it actually fits.
Note
I used the
powerlawpackage in Python to fit the power-law distribution to the data.
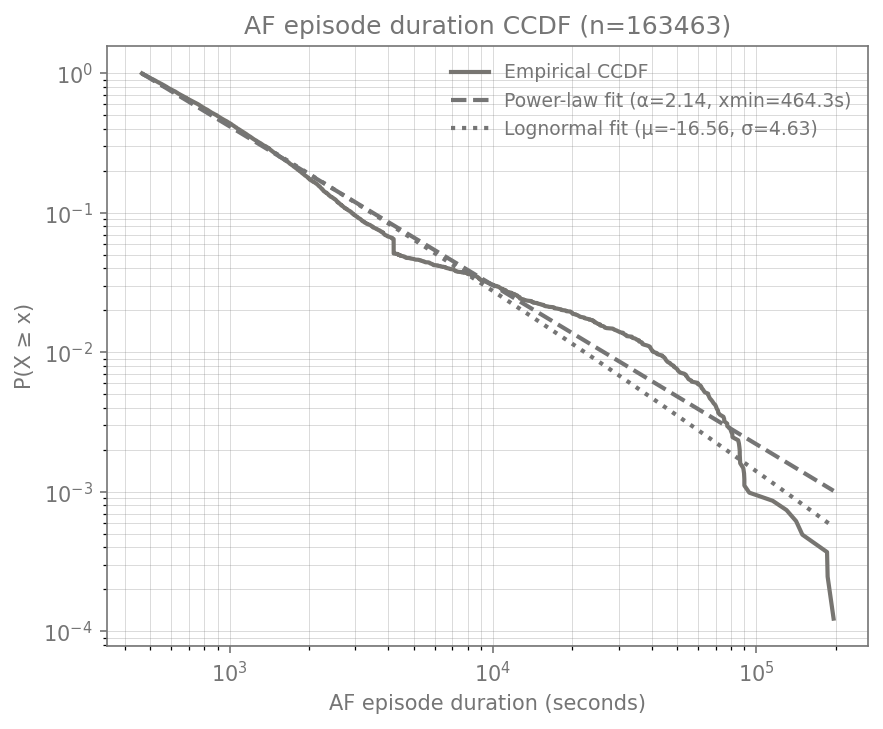
As shown in the plot, the power-law fit holds reasonably well up to around , but breaks down beyond that point. This is consistent with what the log-log histogram shows.
I also calculated summary statistics for the AF duration data; the results are below.
| Metric | Value |
|---|---|
| count | 163,463 |
| min | 0.273 s |
| max | 196,240.000 s (~54.5 hours) |
| mean | 163.625 s |
| median | 21.052 s |
| std | 1,915.805 s |
| variance | 3,670,308.495 |
| 25th pct | 9.428 s |
| 75th pct | 60.822 s |
| IQR | 51.394 s |
| 90th pct | 203.727 s |
| 95th pct | 459.368 s |
| 99th pct | 1,830.515 s |
| skewness | 47.691 |
| kurtosis | 3,139.028 |
| total (sum) | 26,746,675.266 s ≈ 7,429.632 hours |
Limitations
There are a few caveats to keep in mind when interpreting these results:
- No formal model comparison. I only checked fit quality visually and via the power-law fit itself. I haven’t run
powerlaw’sdistribution_compare()against alternatives like log-normal, exponential, or truncated power-law, which would give a more rigorous answer to “what distribution is this, really?” - Possible right-censoring. These recordings are all finite in length, so any AF episode still ongoing when a recording ends would be truncated or dropped. This could artificially suppress long durations and might explain why the fit breaks down after s, independent of the true underlying distribution.
- Sparse tail data. The 99th percentile is ~1,830 s but the max is ~196,240 s — roughly a 100x jump. The extreme tail, where power-law vs. non-power-law behavior is actually decided, rests on very few events, so the fit there is likely noisy.
- Dataset heterogeneity. I pooled AFDB, LTAFDB, Icentia11k, AFPDB, and IRIDIA-AF dataset, which differ in recording modality and patient population. Without checking per-dataset consistency, the combined histogram could just be a mixture of several distributions rather than one clean distribution.
- Unreported
xmin. Thepowerlawpackage automatically selects the point where the power-law fit is assumed to start, and I didn’t report what it chose.
Conclusion
Based on this data and these experiments, I don’t think AF duration follows a power-law distribution. My hypothesis is that it instead follows a heavy-tailed distribution, though I haven’t run any experiments to confirm this yet. I plan to test this and update this post with the results.
References
Datasets I used to find the AF duration:
- https://physionet.org/content/afpdb/1.0.0/
- https://physionet.org/content/icentia11k-continuous-ecg/1.0/p00/#files-panel
- https://physionet.org/content/afdb/1.0.0/
- https://www.nature.com/articles/s41597-023-02621-1
- https://physionet.org/content/ltafdb/1.0.0/
Python packages I used for the experiments:
powerlaw
Original paper on power laws: Pareto, Vilfredo (1898). “Cours d’economie politique”. Journal of Political Economy. 6. doi:10.1086/250536.